
Has the NBA regular season gotten less exciting? A Quantitative Analysis (Part 1)
Introduction
This is a continuation of a previous post. Using excitement, and tension data from inpredictable, I want to explore the question: Has the NBA regular season gotten less exciting?
For some context, both current players and media members have not been shy about calling the regular season “boring” and even “meaningless”. The NBA has made attempts towards addressing this issue, introducing the NBA Cup, an annual in-season tournament with wild court designs, and cracking down on “load management”, where star players take games off to rest for the playoffs, or avoid risking injury in meaningless games. Depite these efforts, NBA TV ratings dropped again this season.
Watching regular season games myself this year, I couldn’t help but notice how skilled modern teams and players have gotten – the game moves much faster, players are jumping higher, and teams are shooting from even further. My own eye test begets the question: If the players have gotten better and the level of difficulty has gone up…how come the NBA regular season is being labelled boring? Are the games actually less exciting, or is viewpoint largely narrative-driven?
Understanding our Data
For data, I scraped every NBA regular season game (total of 34,303 games across 4,593 days) starting from the 1996-97 season to the 2024-25 season from the great Michael Beuoy’s website inpredictable, which has a variety of data publically available. Two key metrics from this site, excitement and tension, can be used to measure how engaging an NBA game might be.
Excitement measures how much a win probability graph moves over the course of the game. To understand this better, we can take a look at the highest recorded excitement game, a quadruple overtime affair between the Knicks and Hawks on January 29, 2017:
As illustrated, the win probability swings wildly in the 4th quarter and overtimes. Generally, a high excitement will mean that both teams traded big shots back and forth towards the end of the game, leaving viewers glued to their seats to see which team will come out on top.
Tension measures how close a win probability graph is to 50/50. From Michael Beuoy himself, the “purpose of the Tension Index [is] to identify games of ‘maximum uncertainty’ in which the outcome remains in doubt for as long as possible.” The idea is simple: we pay more attention to close games and have a tendency to tune out and lose focus when the game is a blowout. The highest tension recorded in the regular season was between the Clippers and Timberwolves on January 10, 2007:
This graph below shows the distribution of excitement and tension. Generally, most regular season games in the past have an excitement of around 30, and tension is around 75. Note: excitement is generally stored on a scale of 0-20, but I’ve transformed it to 0-100, to match tension.
We can also quickly look at the relationship between excitement and tension. Plotting all the games in our data, we can see that as tension increases (i.e. the game gets closer), so does excitement, which makes sense intuitively.
A Quick Look Comparing Seasons
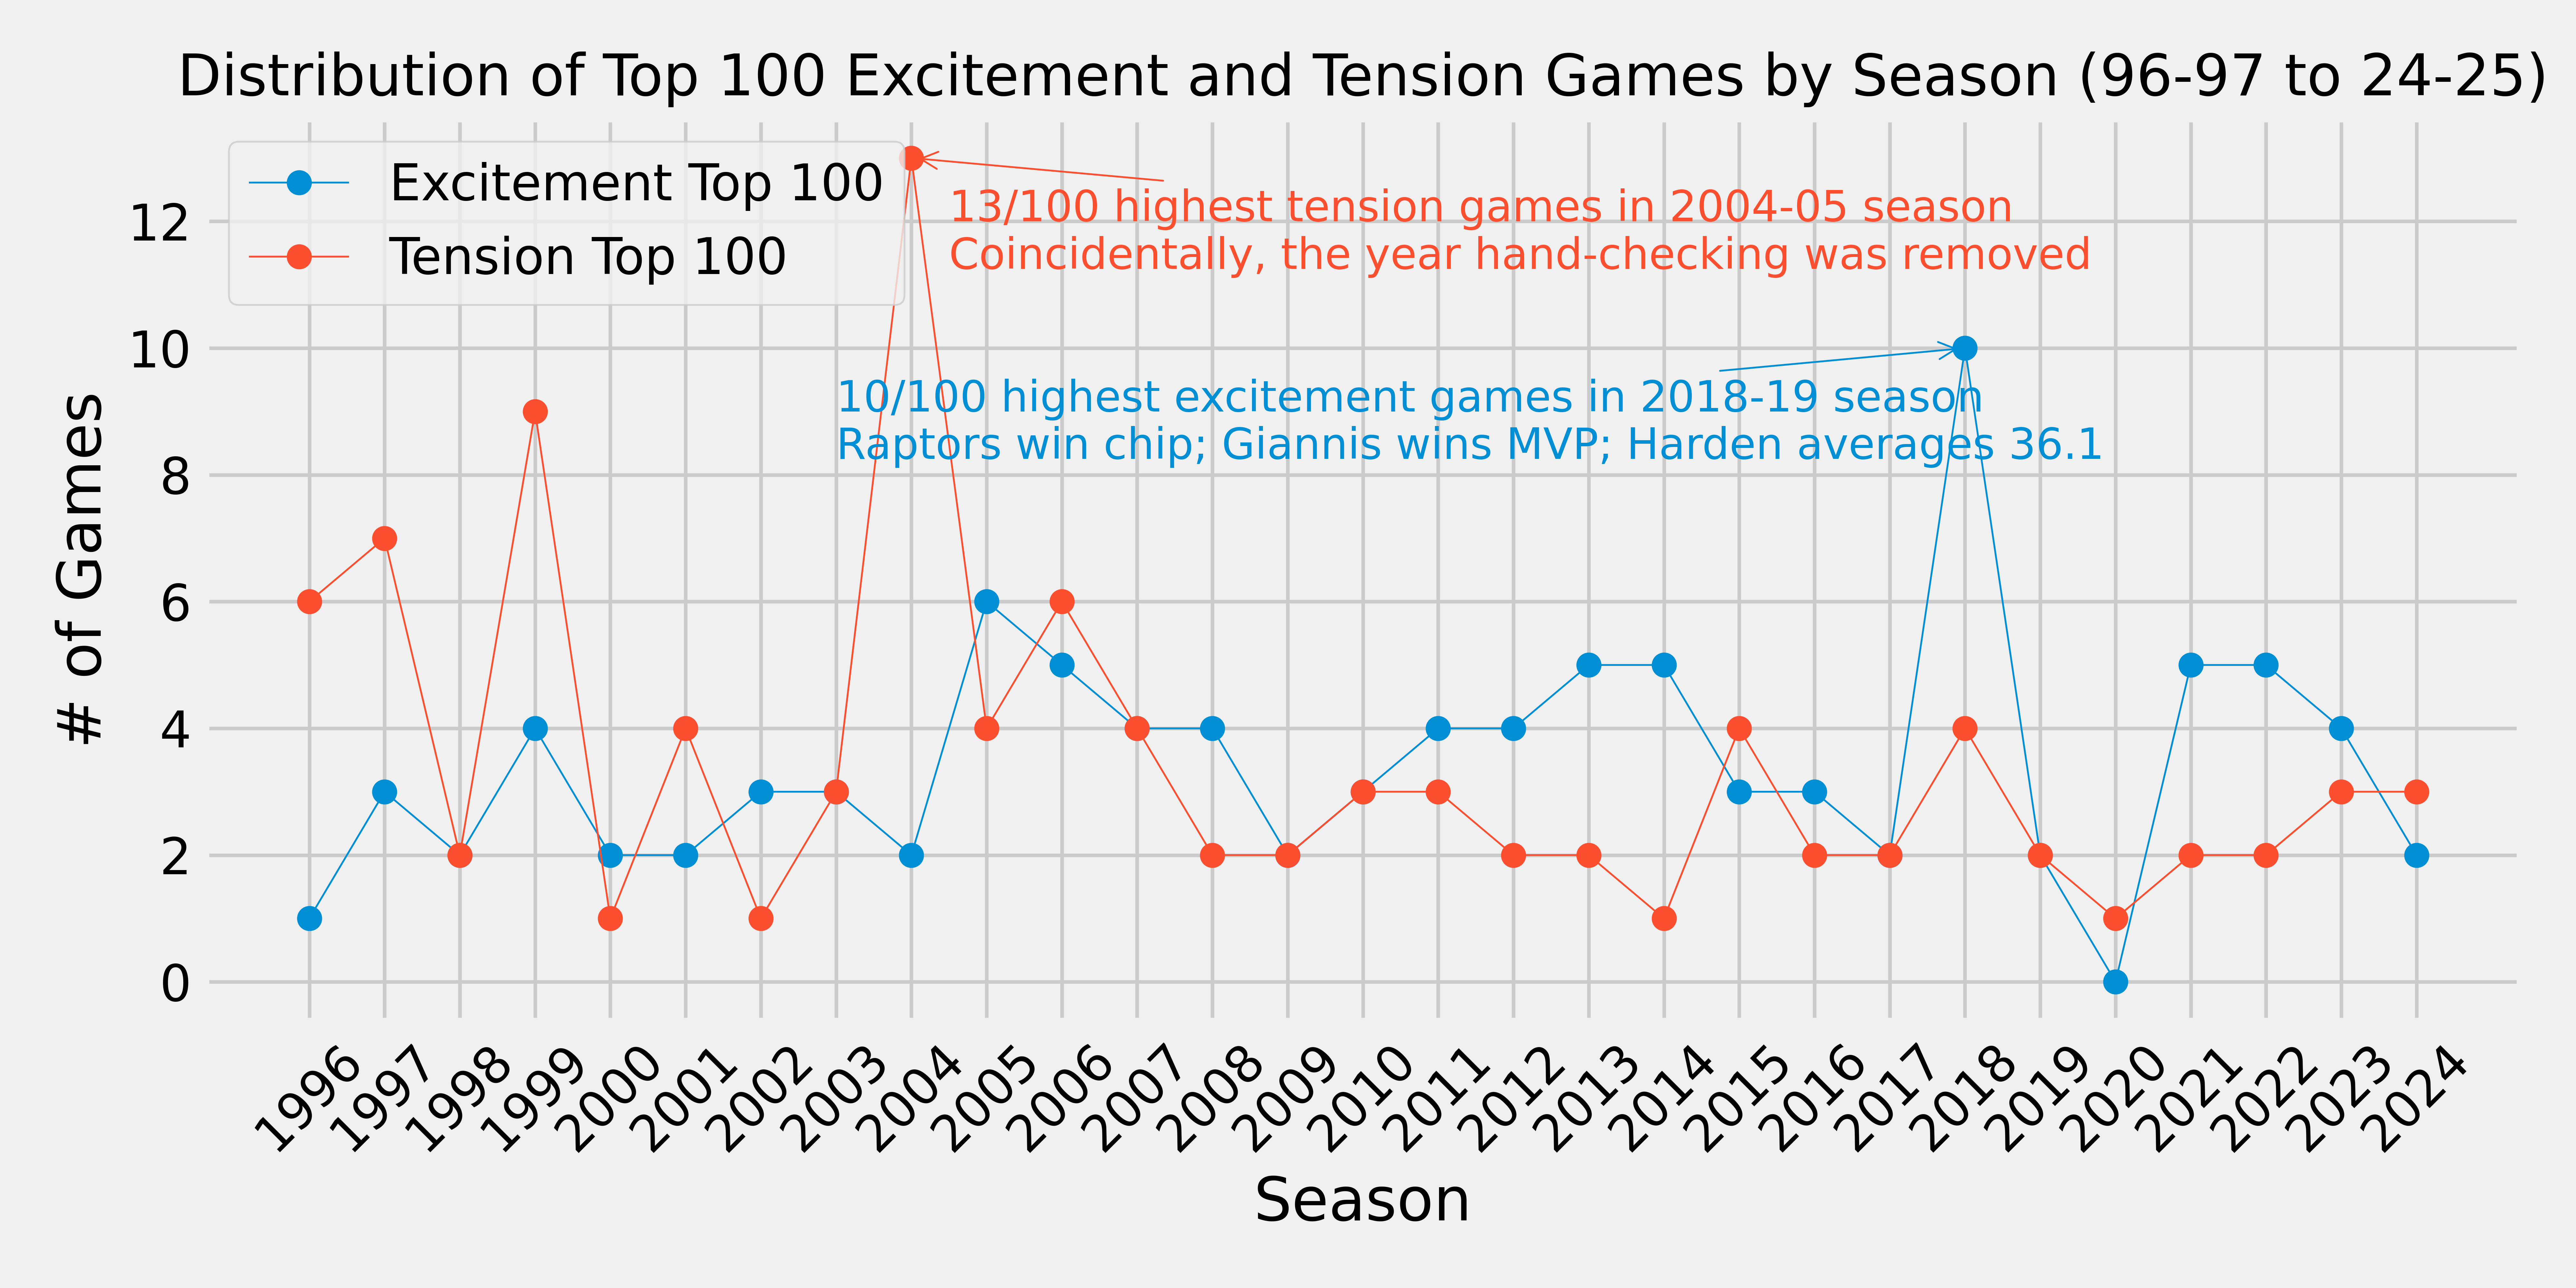
Here I’ve plotted the 100 highest games for both excitement and tension, grouping them by season.
There are 2 notable seasons in terms of tension: 1999-2000 and 2004-05. In the a slower paced era, it makes sense that games may be closer, and therefore have higher tension. However, I’m unsure why 2004-05 would stand out with 13 out of the top 100 tension games, perhaps just luck (or rather, chance).
2018-19 stands out with 10/100 games with the highest excitement. This was the last year of the Kevin Durant Warriors, and while they were expected to cruise to the finals, teams like the Bucks, Nuggets, and Raptors were emerging. James Harden also went on an incredible tear in January, where he scored 57, 58, and 61 points in the span of 5 games in carry efforts for the Rockets. His 36.1 points per game were, unfortunately, were unable to overcome Giannis for MVP, who led his Bucks to the best record in the league at 60-22. Overall, it’s hard to come away with any hard conclusions, so let’s try expanding to the top 500 games.
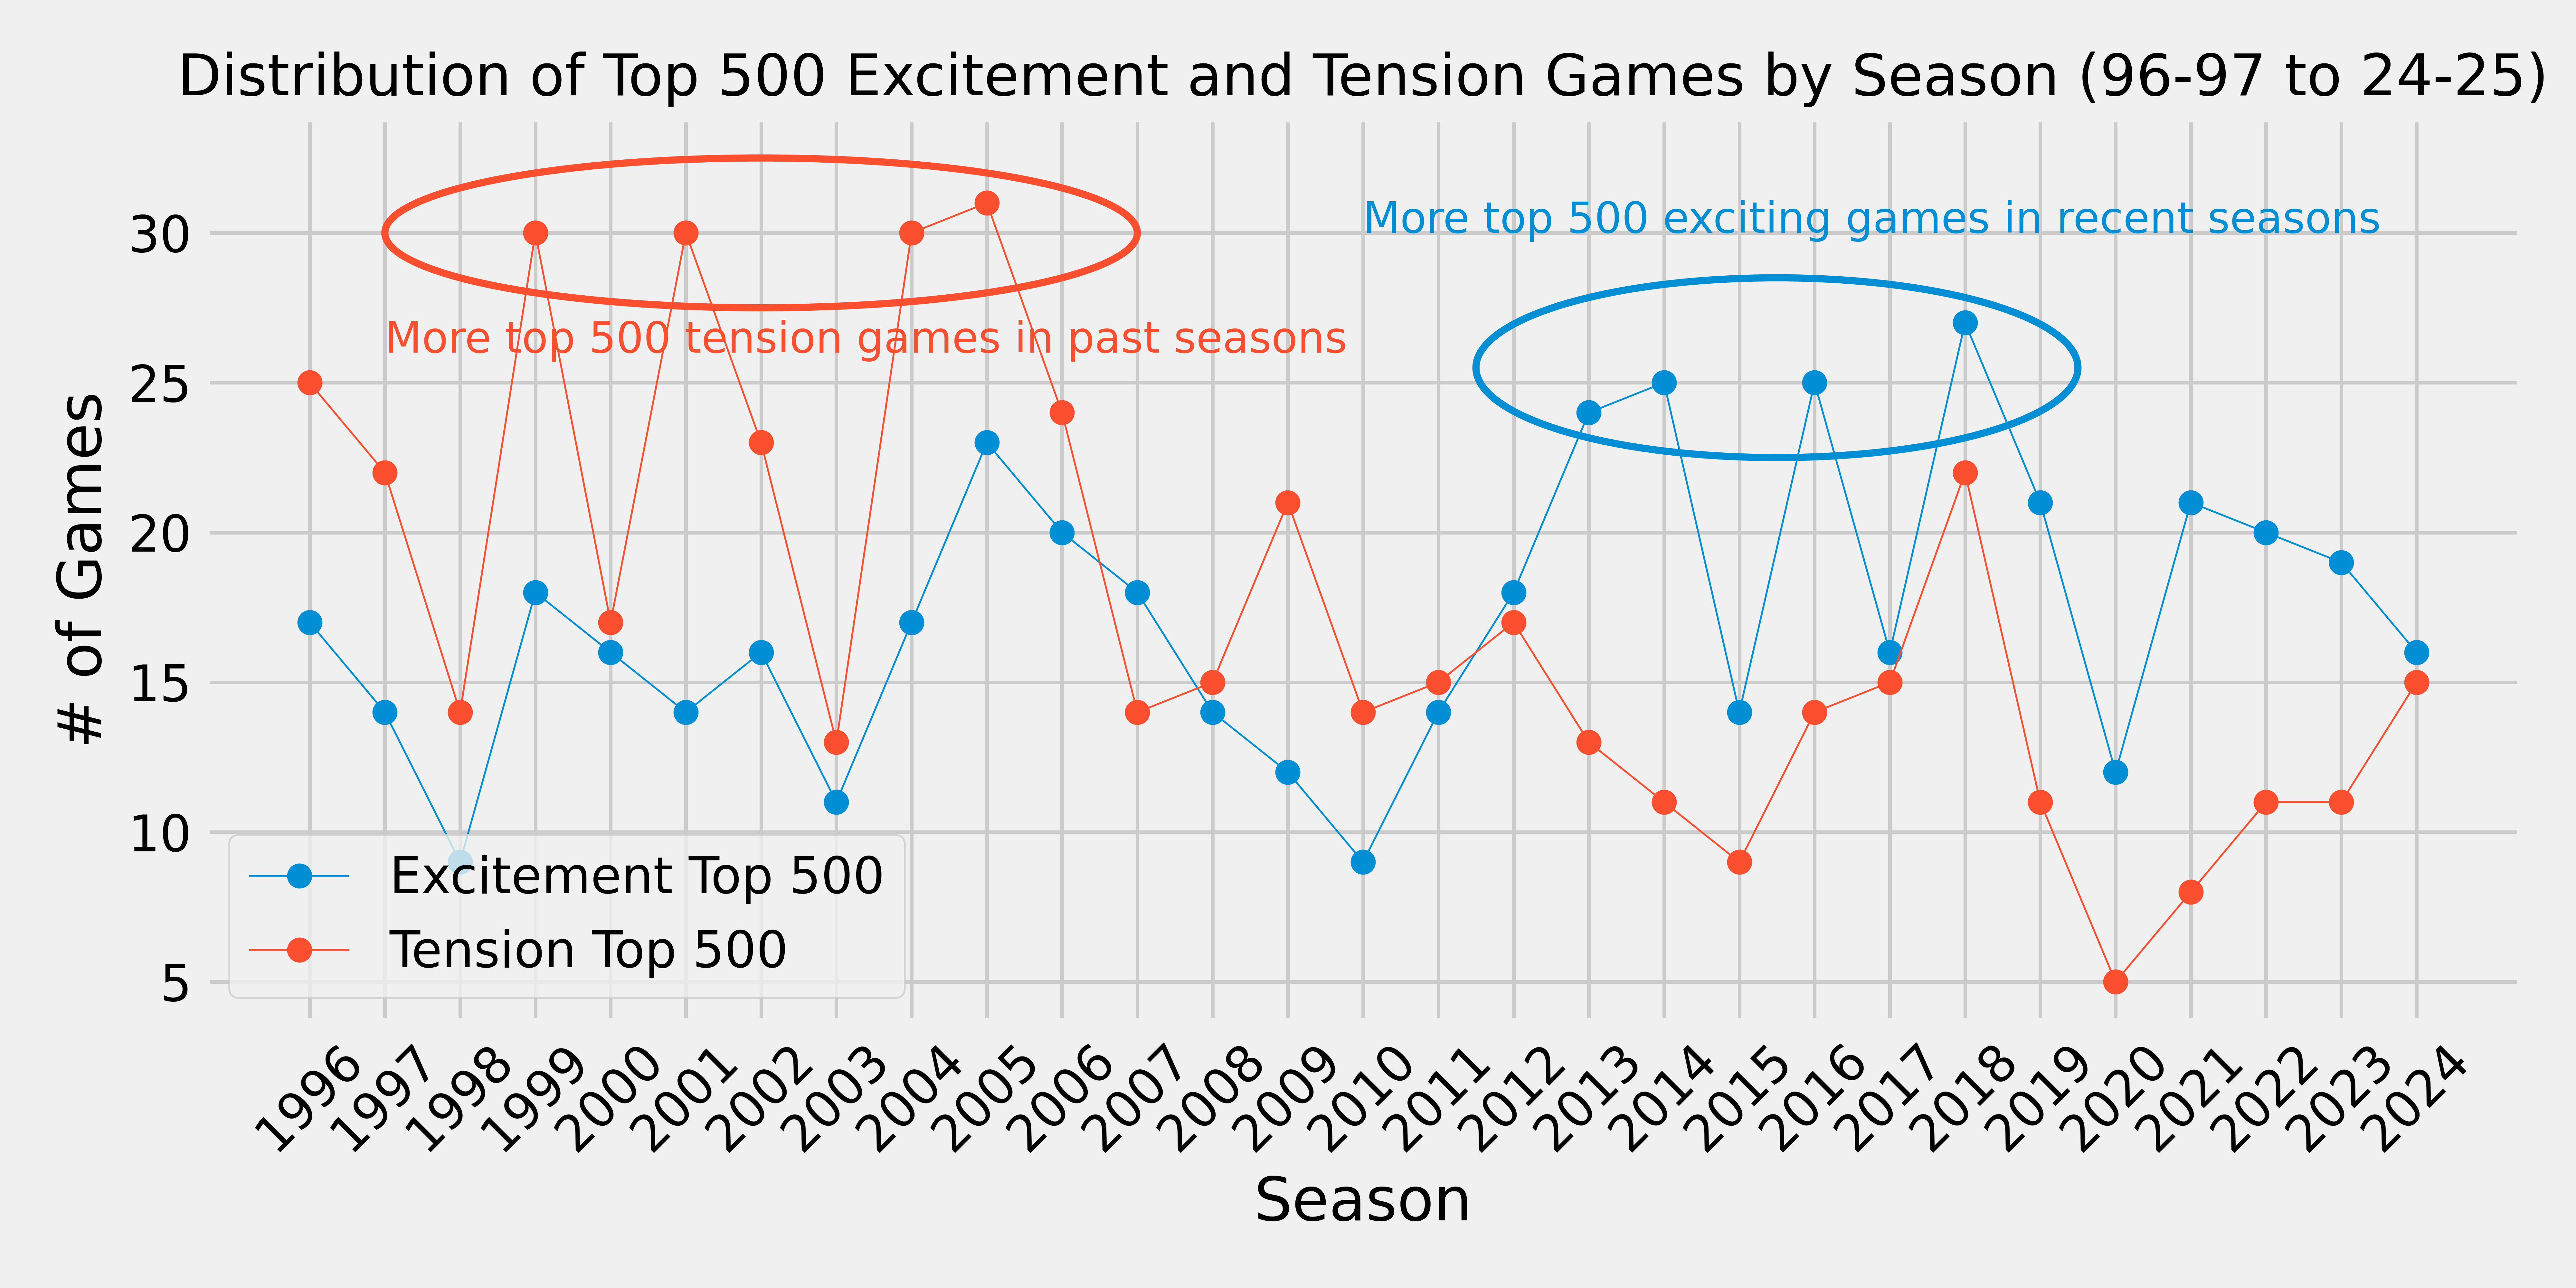
Expanding to the top 500 games in terms of excitement and tension seems to reveal some more trends.
There is a group of four seasons from 1999-2004 which have at least 30 of the top 500 games in terms of tension, each. When teams played slower and the game was still dominated by big men, it makes sense that the score remains close, and the outcome of the game lives more in uncertainty. I
n more recent years, from 2013-2018, there is a group of seasons which seem to peak in terms of games ranking in the top 500 of excitement. During this time, the surge in three pointa attempts was spurred by exciting guards like Stephen Curry, Damian Lillard, and James Harden. The difference in tension and excitement over time lines up with how the league has shifted to emphasize three point shooting, which causes large, more unpredictble swings in the game. Barrages in scoring can quickly lead to blowouts, decreasing tension within games. On the flip side, the ability to shrink leads via transition and three pointers has also added a greater comeback element, which can lead to more exciting games. The quicker pace also results in more back and forth trading in crunch time, leading to an increase in excitement.
Conclusion
From this quick look at top regular season games by season, it is tempting to say that back in the day, games were closer and therefore more engaging, and that in more recent times, the high scoring and more fast paced landscape has resulted in more exciting (wilder swings in win probability) games. It is certainly promising that this cursory look at our two metrics seems to reflect the shift in the NBA over time; however, we are currently unable to conclusively claim from that the regular season has gotten more or less exciting.
It’s also worth to note that these metrics fail to account for the other many factors which affect our perceptions of the regular season.
On a game level, a matchup ranking high in excitement or tension last year between the Trailblazers and Magic (sorry Portland and Orlando fans) might never be watched by the average fan. Fans are much more likely to watch marquee matchups, big market teams, and nationally broadcasted games. If these games are duds, their perception of the regular season would be dampered, despite other quality games being played that day.
On a more macro level, issues such as parity, load management, and the decline in the TV product of the NBA all contribute to negative perceptions of the regular season. The increase in commercials, difficulty of watching games live, officiating problems, and dragged out fourth quarters may all cause fans to view games as “boring”, compared to back in the day.
Future Work
While looking at the excitement and tension by season, a question that came up to me was: “How does parity influence the engagement levels of the regular season?” Logically, it would make sense that viewers will follow the season more closely when there are no obvious favorites (such as the Durant Warriors). If that were the case, we might expect tension and excitement to be higher during seasons where there is no clear cut contender (although hate watching is a thing nowadays…) I plan to explore this in my next post.
Additionally, I want to take a more rigorous statistical approach to see if excitement and tension has decreased over time. We’ve only looked at the top games in terms of excitement and tension, so there is a lot we don’t know about the general distribution of our metrics across seasons. Perhaps us flawed humans do tend to base our perceptions of the regular season on the more memorable games, but analyzing each season as a whole will be more informative in either confirming our belief that excitement and tension have increased and decreased, respectively, or reveal more nuance in this take.